When in doubt randomize! Randomization removes some of the inevitable, but often unconscious, bias to your data when you arbitrarily locate sample plots. If you are simply looking around for a “good” place to put your sample plots, you will probably NOT place them in brushy, hard to get to locations. It is normal when arbitrarily locating sample plots to look around and then put the samples where you think they are representative of the conditions you see. You may or may not be correct. Randomization, if done properly, can minimize this type of bias and usually gives you a better measure of the average condition of whatever you are measuring in your site.
Randomization means that any given location in your site has an equal probability of being sampled, including edges, hard to get to places or seemingly uninteresting places. There are many ways to randomly locate your sample plots, two are described here:
Overlaying a grid on a map of your study site and then randomly selecting which cells will be sampled (see Figure 1). Once the grid is overlaid on your site map, you would select random numbers from a random numbers table (click here for a random number table you can use) or you can use a calculator with a random number function to select two random numbers that will locate your sample location on the grid. This system works well if you have a large site and want to do a good job of randomizing across the whole site. This system also works well if you are placing small sample plots within large plots. For example, if you were using a 10 x 10 meter plot for sampling vegetation, you might use this to randomly locate sub-plots for sampling earthworms (35 cm x 35 cm plot) within the larger vegetation plot.
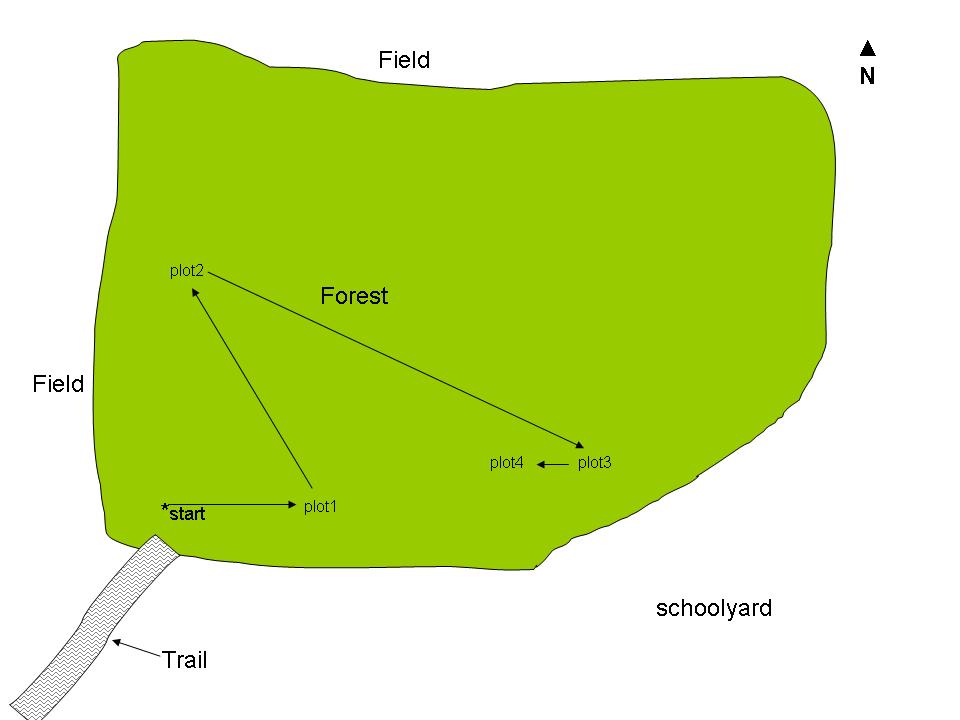
Random walk, uses a combination of random numbers to select the direction and distance you will travel to locate your sample plots. This is done “on the fly”, rather than in advance as with the grid overlay system. You start at some arbitrary location in your site, select a random number between 0 and 360 (the number of degrees on a compass) and use that number to select the direction you will travel, then select another random number for the distance you will travel in that direction (use a range of distances that make sense for your site). To select another sample location, select two more random numbers, one for the direction and one for the distance traveled. Continue in this manner until you have all the samples you need (see Figure 2).
Random Number Table
If you use the table, start in the upper left corner and work your right across row 1 then row 2, etc. using them in order. Cross off a number once it is used.
|
0
|
9
|
8
|
2
|
0
|
7
|
3
|
6
|
3
|
6
|
1
|
|
1
|
3
|
9
|
3
|
5
|
7
|
7
|
2
|
5
|
8
|
8
|
|
2
|
5
|
2
|
4
|
4
|
4
|
5
|
9
|
9
|
2
|
1
|
|
1
|
3
|
9
|
4
|
1
|
2
|
6
|
7
|
3
|
8
|
7
|
|
6
|
9
|
1
|
8
|
8
|
9
|
6
|
8
|
2
|
3
|
2
|
|
4
|
4
|
1
|
6
|
5
|
2
|
9
|
5
|
5
|
1
|
5
|
|
7
|
5
|
6
|
1
|
5
|
5
|
10
|
3
|
2
|
3
|
2
|
|
1
|
1
|
2
|
3
|
3
|
3
|
8
|
7
|
5
|
0
|
1
|
|
2
|
5
|
3
|
6
|
9
|
9
|
5
|
5
|
5
|
7
|
6
|
|
1
|
5
|
9
|
3
|
3
|
4
|
6
|
4
|
3
|
1
|
2
|
|
5
|
4
|
6
|
1
|
5
|
5
|
4
|
9
|
9
|
2
|
1
|
|
4
|
3
|
5
|
4
|
5
|
4
|
2
|
4
|
1
|
8
|
7
|
|
3
|
7
|
1
|
9
|
6
|
4
|
9
|
4
|
6
|
6
|
4
|
|
2
|
4
|
2
|
3
|
5
|
5
|
8
|
1
|
8
|
4
|
1
|
|
9
|
7
|
4
|
9
|
9
|
4
|
3
|
6
|
6
|
7
|
6
|
|
1
|
1
|
4
|
8
|
3
|
9
|
8
|
1
|
9
|
8
|
3
|
|
8
|
7
|
6
|
9
|
1
|
5
|
9
|
7
|
8
|
0
|
4
|