Collecting earthworm data opens opportunities for you to analyze your data. Analysis allows you to convert the raw data you have collected into numerical values. Methods of analysis often use mathematical equations to produce standard units or statistical units. Some of the most commonly used in earthworm studies are spatial analysis alongside more mathematical based density, biomass and diversity analysis. Analyzing your own data (or previous data) can add depth to your study and also adds another level of learning.
Remember, while there are several optional types of data, all the data we need from your study can be seen on the study data sheets. Analyzing your data can be of value to you but . Don’t be shy, submit what data you can given your goals and interest level!
We provide guides for calculating:
- Density - is the average number of earthworms per unit area, this is commonly given as the number of earthworms per square meter. To do this you need to have a count of earthworm numbers and the area in which these earthworms were collected.
- Diversity - measures how many earthworms species are present at your site an how numbers are distributed between these species. To do this you need to have a list of earthworm species with a count of the number of earthworms in each species category.
- Biomass - a measurement of the mass of earthworms present in the soil. This requires you to have collected and preserved earthworms.
Introduction
Density, is the average number of earthworms per unit area, this is commonly given as the number of earthworms per square meter. It is very simple to calculate, all you need is:
- A count of earthworm numbers.
- The area in which these earthworms were collected.
Earthworm data is generally reported on a per square meter basis (#/m²). The Great Lakes Worm Watch’s Single and Multiple Plot Studies use a plot size of 33cm x33cm, using this area makes it very easy to convert counts of earthworms into per m2 densities. Density is commonly used in geography as a measure of population. It is a simple and effective method of judging the extent of earthworm invasion in your plot, site or even habitat. It is also useful for cross comparing sites. What condones high or low earthworm density is actually quite vague, density is quite relative to the individual areas were you have collected your earthworms (i.e. site or plot has high density compared to surrounding environment). BUT as a general rule areas with high densities of earthworms are often more heavily invaded than areas of low-density sites.
Density is also a useful method for evaluating the average earthworm conditions at your site or for the habitat as a whole. More often than not, people are interested in the average density of earthworms for a given habitat or site from the individual plot data.
Methods
Converting your plot based data to “per m²"
If you have used the 33cm x 33cm plot (use by the GLWW) then simply multiply the number of earthworms for that plot by 9 to get the same data “per m²”. Each 33 x 33cm plot is 1/9th of a m² (see illustration below)
Number of earthworms per 33x33 plot * 9 = Earthworm Density per m²
Example
If you collected 13 earthworms from your 33cm x 33cm sample plot, then the density of earthworms per m² is 9 x 13 = 117/m²
Number of earthworms (per 33 by 33 plot) * 9 = Earthworm Density per m²
13 * 9 = 117 Earthworms per m²
Average Density
Before we use or share your data we might calculate the average. Using an Average is useful if you want to summaries your site or habitat conditions. The number of sample plots determines the reliability of your average. When you are calculating you average it is important to remember that earthworms can be apparent in one plot and absent from a plot one meter away! If you have collected earthworms from 3 or less plots your average may not be representative of the whole habitat. But an averages density is easy to calculate:
Sum of earthworm density from all plots / Number of plots sampled = Average Earthworm Density per m²
Extra - Density of an individual Species
You can also calculate the density of juveniles/adults, species or genus. Instead of using the total number of earthworms per plot (or for your entire site) you use the number of earthworms in that particular species or other category.
E.g. if you have 100 worms in total 7 of which are earthworm species B, therefore the density of earthworm species B per square meter is 7 x 9 or 63 species B per square meter.
Introduction
Diversity is one of the most well known and common used indices in ecological research. It is often used as an indicator of good environmental quality and this is very true in the case of plant and animal communities. BUT in areas in the Midwest where earthworms are non-native, earthworm diversity is a bad thing. The more diverse an earthworm community the more species have successfully invaded the habitat, this has significant negative implications on the native plant and animal communities. High earthworm diversity often means a low plant and animal diversity!
- List of Earthworm species
- The number of earthworms in each species category.
To work out diversity of a community you simply count the number of species, right? Well, yes and no, the majority of times you also need the number of earthworms in each species. For example, say there are two sites that each contains 7 plant species. In one site, two of those species account for 90% of the total plant community with the other 5 species being present at very low levels, while in the other site; all 7 species are about equally abundant. Just because there have the same number of species they do not have the same species diversity. It is often best to have a measure of diversity that includes both richness (number of species present) and their relative abundance.
Several indices of diversity have been developed to help you do just that (see table below). One that is very commonly used in animal and plant communities is the Simpsons Diversity Index anther common index is Shannon. Because of Simpson’s wide range of applications it will be explained in more detail. It can be interesting to see how the different measures of diversity can sometimes give different impressions of the same community! So if you are good at statistics or feel like a challenge have a go at using more than one and see how they differ.
Diversity is most commonly used as an indicator of your site as a whole using ALL of your pot data you can also calculate it on a plot by plot basis (i.e. for each individual plot) which allows you to calculate an average diversity per plot.
|
Index* |
References |
Emphasis |
|
Shannon's H' =[-Σp)]-[(s-1)/2N] |
Shannon and Weaver 1964; Poole 1974 |
Integrates the number of species and relative abundance; derived from information theory; measure of entropy for the sample; full formula is and expanding series; the first two terms are shown here. |
|
Simpson's D= Σ² |
Magurran 1988 |
A measure of dominance by one or a few species; the probability that two individuals selected from the population at random will be of the same species. |
|
Adapted from ‘Hale et al 1999’ |
Methods
Simpson’s Diversity index
Simpson’s Diversity index produces a value between 0 and 1, values around 1 have high diversity and values around 0 have low diversity. Compared to other diversity indexes calculating Simpson’s diversity index is actually quite simple, if you are good at maths you can even work it out without using a calculator! Although it is mathematically quite simple it’s equation (see below) does look quite complex, but don’t let the algebra scare you it is actually quite straightforward to calculate.
D = (∑n(n-1))/(N(N-1))
It is easiest to calculate this by hand using a table format, you can do this by hand but we have also provided excel spreadsheet. Instructions for calculating Simpson’s Diversity index from your earthworm species list using both methods is provided below. It is important to understand the basics of the mathematics, so try the mathmatics behind the statistic, so try following the example in ‘Calculating Species by Hand’ before you jump to the excel method’.
Calculating Simpsons Diversity by Hand
To calculate species diversity can be done using a species table with the names and count of each species of earthworm. For the sake of simplicity in the example below our species are called EarthwormSP 1, 2, 3, 4, 5 and 6 but your earthworm species names will be more complex.
Step 1: Look at your species list. You should have a column for species name and the number/count of earthworms that was collected in this individual species (otherwise known a n).
| Species Name | Counts of species (n) |
| EarthwormSP 1 | 3 |
| EarthwormSP 2 | 2 |
| EarthwormSP 3 | 7 |
| EarthwormSP 4 | 11 |
| EarthwormSP 5 | 9 |
| EarthwormSP 6 | 4 |
Step 2: In a new column entitled n-1, you have to minus 1 from the number/count of individual species (in algebra this is written n-1!).
| Species Name | n | n-1 |
| EarthwormSP 1 | 3 | 2 |
| EarthwormSP 2 | 2 | 1 |
| EarthwormSP 3 | 7 | 6 |
| EarthwormSP 4 | 11 | 10 |
| EarthwormSP 5 | 9 | 8 |
| EarthwormSP 6 | 4 | 3 |
Step 3: Times the n-1 column by your original n value. If you have done this correctly you should have something looking similar to the table below.
| Species Name | n | n-1 | n(n-1) |
| EarthwormSP 1 | 3 | 2 | 6 |
| EarthwormSP 2 | 2 | 1 | 2 |
| EarthwormSP 3 | 7 | 6 | 52 |
| EarthwormSP 4 | 11 | 10 | 110 |
| EarthwormSP 5 | 9 | 8 | 72 |
| EarthwormSP 6 | 4 | 3 | 12 |
Step 4: The next step is to calculate ∑n(n-1), the sigma (∑) means ‘sum’ so this is simply the n(n-1) column added up!
E.g. If you have done this correctly in the example your ∑n(n-1) should equal 154
Step 5: If you look at the equation D = (∑n(n-1))/(N(N-1)). You can see that you already calculated the first part (∑n(n-1)) in step 4, now all you need is the N(N-1) value. N is the total number of worms in your sample otherwise, to calculate this you need to the sum of the count of earthworms (or the sum of n). Once you have this N value you can work out N(N-1).
e.g. So for our example the sum of n equals 36, therefore N = 36. If N = 36, N(N-1) is 36(36-1) or 36 x 35, therefore N(N-1) = 1260
Step 6: As now all you have to do is put into Simpson’s equation. This last step involves dividing your ∑n(n-1) value by your N(N-1) value.
E.g.This means you divide 154 by 1260, which equals 0.12222 (to five decimal places).
Calculating Simpsons Diversity Using an Excel Spreadsheet
If you have done a Great Lakes Worm Watch study and sent in your sampled earthworms you will most likely have a list of the species of earthworms and their numbers found in your site. You can use this species list alongside an Excel spreadsheet to easily calculate the diversity of your site.
Download the Simpson’s Diversity spreadsheet
Step 1: Once you have downloaded this spreadsheet all you have to do is copy the counts of each species into their respective species box.
You may have noticed the cells highlighted in pink entitled ‘n-1’ and ‘n(n-1)’ have been changing as you enter data. It is important that you DO NOT CLICK ON THE PINK HIGHLIGHTED CELLS! These contain excel formulars that can easily be edited simply clicking them by accident.
Step 2: Once you have done this for all you species you can delete the extra rows for species that are not apparent at your site, you do this by right clicking next the row number (grey box to the left of ‘Species’) and selecting ‘Delete’. You have to repeat this for all absent species otherwise they will affect your diversity index.
Step 3: Next to the cell labeled ‘Simpsons Diversity Index’ a value will appear this is your Simpson’s value! Keep this value safe by writing it down, copying into another document or by saving the spreadsheet.
Extra - Diversity across a transect
If you have carried out a plot study between to habitat types along a transect it may be interesting to see how diversity changes along this transect. You can then work out the species diversity for each plot and see how the species structure (i.e. diversity) changes between the habitats.
Introduction
Biomass data can be valuable when asking certain questions but is a bit trickier to calculate for earthworms than you might think. So if you are interested or motivated to do some simple measurements and use a spreadsheet to calculate biomass, we would appreciate the additional data. Learn more about how to calculate earthworm biomass or download a spreadsheet that will help you.
Calculating Earthworm Biomass
At first thought, calculating earthworm biomass seems very easy, simply weigh the earthworm right?
Well, yes and no. Like humans, earthworms are mostly made up of water. But unlike humans, the fresh weight of an earthworm can change up to 20% depending on how much moisture there is in the soil. In addition, whether an earthworm has a full or empty gut can also affect its fresh weight by 10 to 20 percent. So, if you want a measure of earthworm biomass that is comparable to other sites, other times of the year or across different years, you need to use a measure of biomass that eliminates the problem of moisture and gut contents.
Dry Weight Method
To eliminate the problem of variability due to moisture content, you can dry your earthworms at 60°C for 24-48 hours to get “dry earthworm biomass”. That’s not so hard.
To eliminate the problem of variability due to gut contents you can do one of three things:
- Keep the live earthworms in containers until they empty their guts (24-48 hours, if they don’t die in the process)
- Dissect the preserved earthworm and flush their opened gut until all contents are removed (a LOT of work).
- “Ash” the dry earthworm in a muffle oven at 500°C, which removes everything except the gut contents, which is mostly composed of mineral soil. You would then subtract the weight of the ash from the dry weight of the earthworm to get “ash-free-dry earthworm biomass”.
Learn more about determining “ash-free-dry earthworm biomass”.
If that seems like a lot of work, you are right. The other problem with using ash-free-dry biomass is that the process destroys your earthworm specimens. This is a problem if you want to keep them for future reference, or send them to us when you are documenting an earthworm occurrence.
Allometric Equations Method
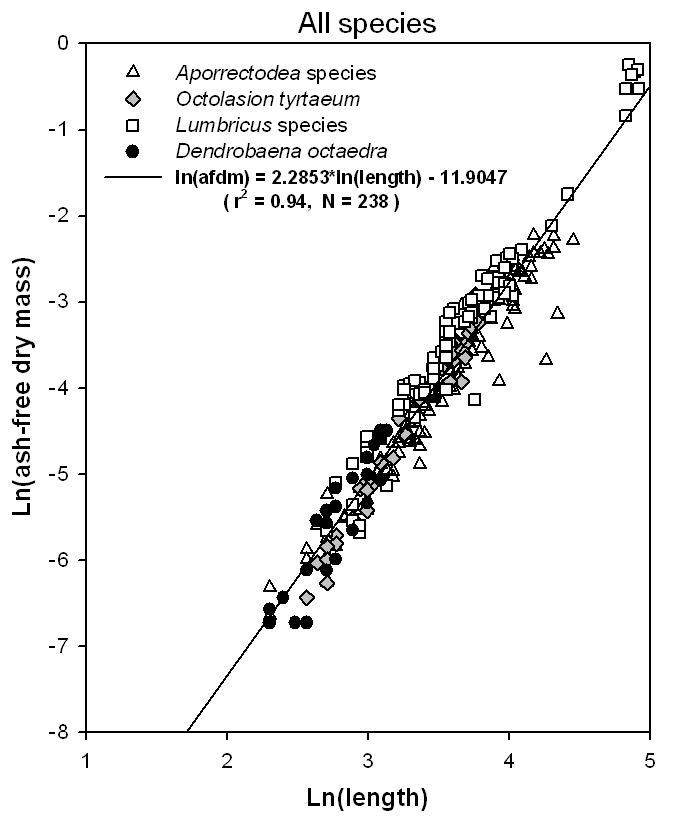
Scientists from many areas of study have dealt with this same problem by creating equations that estimate the biomass value of a given organism using certain body measurement that are strongly correlated with biomass. Because earthworms are basically a cylinder, it is possible to determine an allometric equation that reliably estimates ash-free-dry biomass using preserved length (mm). Measuring the length of your earthworm is much easier than determining ash-free-dry biomass directly! We have provided you with an equation that allows you to use a spreadsheet to calculate “ash-free dry grams” (AFDg) of biomass of earthworms using the length (in millimeters) of the preserved earthworms.
How can I use this allometric equation to estimate the biomass of my earthworms?
We have provided a spread sheet that you can use to do the calculations. Download the spreadsheet here. There are a couple steps you need to take to calculate ash-free-dry earthworm biomass using our equation. First, you must use preserved earthworms, because it is impossible to get an accurate length measurement of a squiggling, stretching and contracting earthworm…at least not to the nearest millimeter! Once you have preserved earthworms
- Measure the length of your preserved earthworms to the nearest millimeter (mm). The equation is only accurate if the length measurement is in millimeters. If the earthworm is curved, use some forceps to straighten it out along the ruler. Once this earthworm was straightened out, it’s full length measurement was 50mm.

- Enter your length measurements into a spreadsheet.
Download the spreadsheet here. - Copy and paste the formulas that we provide in our example spreadsheet into the rows with your data to calculate the “ash-free dry grams” (AFDg) of biomass of each earthworm. Then sum the AFDg of biomass of all the worms in a given plot to get total earthworm biomass for that plot.
Read more about what you are seeing in the spreadsheet or to see how to do the calculation manually. - Finally, you can convert the total earthworm biomass of each plot to an estimated total earthworm biomass per m² by multiplying the plot total by 9 (assuming it is a 33cm x 33cm plot).
For example, in our example spreadsheet, there were three earthworms collected with lengths of 18, 20, and 24 mm. Their AFDg of biomass of each were 0.005, 0.0064, and 0.0096, respectively and the total biomass for the plot was 0.021 AFDg. To convert the plot value to a per square meter basis, we simply multiply the plot total by 9.
0.021 x 9 = 0.189 AFDg/m²